The supply complements our existing solar carpark and rooftop systems – at Bedford Park, we have 7647 solar panels charging a 2.2 MW system that generates 20% of electricity needs at the campus.
In 2020, we installed four solar canopies – innovative stand-alone systems used for shelter and device recharging. The canopies draw energy from dual-sided solar panels that form the roof structure and charge built-in batteries stored in the seating. They’re a great example of Living Labs, providing a practical demonstration of how solar energy and storage can be integrated into real-world learning opportunities.
We know there are still challenges to address in reducing our emissions – electricity and gas used for lighting and building air-conditioning, and fuel used to transport staff and students via airplane, bus and car – but we’re charging ahead, with more initiatives to come.

Reducing greenhouse gas emissions
Flinders University conducts an annual greenhouse gas (GHG) inventory in line with the GHG Protocol's Corporate Standard, using an evidence-based approach to track and reduce greenhouse gas emissions through the development and implementation of targeted initiatives.
We’ve created a decarbonisation roadmap outlining organisational opportunities to reduce carbon emissions aligned to the 1.5°C Paris Target (IPCC pathway) through 2030. This target calls for a global net anthropogenic GHG reduction of 42% by 2030 and net zero by 2050.
Climate positive approach
Our focus is to:
- Identify, develop and implement ambitious and achievable opportunities towards emissions reductions for scope 1 and 2 emissions aligned with 1.5°C Paris Target
- Engage our operations and value chain to address indirect emissions
- Achieve a net-negative (25%) emissions profile (scope 1-3) by 2030.
- While already achieving 100% renewable electricity, our decarbonisation roadmap outlines our pathway to further decrease gross direct GHG emissions by at least 42% by 2030, using 2022 as the baseline year.

Our decarbonisation roadmap to 2030 is informed by a variety of opportunities, including:
Scope 1 direct emissions from owned or controlled sources, eg emissions from fleet vehicles and gas boilers.
- Identify, develop and implement ambitious and achievable opportunities towards emissions reductions for scope 1 and 2 emissions aligned with 1.5°C Paris Target
- Engage our operations and value chain to address indirect emissions
- Achieve a net-negative (25%) emissions profile (scope 1-3) by 2030.
- While already achieving 100% renewable electricity, our decarbonisation roadmap outlines our pathway to further decrease gross direct GHG emissions by at least 42% by 2030, using 2022 as the baseline year.
Scope 2 indirect emissions from the generation of purchased energy.
- Maintaining a 100% renewable electricity supply.
Scope 3 indirect emissions that occur in the value chain, including both upstream and downstream emissions.
- Through our procurement of goods and services, ensure our supply chain decarbonises in line with our overall emissions reductions, ensuring that at least 42% of the supply chain consists of carbon-neutral or SBTi-aligned products and services.
- Reducing business travel by 30% by 2030 and reducing employee vehicle commuting emissions by 15%.
- Reducing the emissions intensity of capital goods (including construction) by 25%.
- Reduction in total waste by 30% and recovery of high-value deposit recycling materials.
- Reducing mains water usage by 20% by connecting to an integrated water recycling system.
Flinders University annual greenhouse gas inventory
Flinders University uses emissions calculation methods and conversion factors for each emission source, drawing on primary data and reliable sources commonly used in Australian carbon accounting.
Notable sources include the National Greenhouse Accounts (NGA) Factors, the GHG Protocol, and other relevant life cycle analysis databases, such as the Australian National Life Cycle Inventory Database (AusLCI).

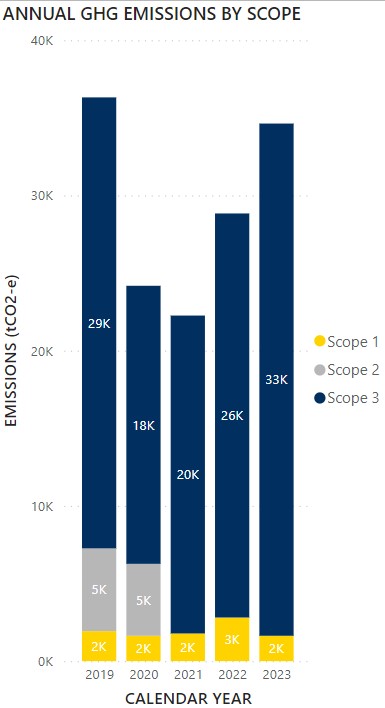
Flinders University is committed to reducing its greenhouse gas emissions, across all three scopes.

In 2023, Flinders University's GHG emissions profile totalled 34,631* tCO2e, 1634 tCO2e scope 1 direct emissions, 0 tCO2e scope 2 emissions (due to 100% renewable SA electricity PPA), 32,997 tCO2e scope 3 indirect emissions.
| Year | Scope 1 (tc02e) | Scope 2 (tC02e) | Scope 3 (tC02e) | Total (tC02e) |
|---|---|---|---|---|
| 2019 | 1,932 | 5,332 | 29,054 | 36,318 |
| 2020 | 1,634 | 4,635 | 18,490 | 24,759 |
| 2021 | 1,782 | - | 23,321 | 25,103 |
| 2022 | 2,805 | 7 | 26,028 | 28,804 |
| 2023 | 1,634 | - | 32,997 | 34,631 |
*Flinders University is continually improving data collection and its GHG inventories are updated accordingly. These figures were last updated March 2024. While Flinders University’s GHG inventory is reviewed by third parties, the data has not been audited under the Climate Active criteria. For larger, one-off strategic projects, Flinders University also calculates embodied emissions of materials construction, use and end-of-life of buildings, which are excluded from the figures above to allow for year-on-year comparisons.
Flinders University baseline year moving forward is 2022 to establish a post-COVID benchmark, with emissions calculated retrospectively to 2019 to assess a pre-COVID profile. Emission reductions were observed in 2020 and 2021, as a result of COVID-19 impacts and the implementation of 100% renewable electricity.
With the return to normal operations, activity and associated emissions have increased in 2022 compared to 2021. This is primarily due to factors such as business travel, refrigerants, and employee commuting.
While Flinders University has made significant progress in reducing its environmental impact over the past few years, increases in scope 3 emissions sources have been balanced by substantial reductions in other areas.
Our 2022 GHG emissions have decreased by approximately 21% compared to 2019 levels, due to our renewable energy supply and concerted effort to reduce paper usage, waste, and increased energy efficiency.
Flinders University has also implemented renewable electricity sources, resulting in a 61% reduction in scope 1 and 2 emissions.
Our commitment to environmental sustainability remains strong as we continue to explore new ways to minimise our GHG emissions footprint and promote a climate-responsible future.
![]()
Sturt Rd, Bedford Park
South Australia 5042
South Australia | Northern Territory
Global | Online
Follow Flinders


